

Let’s discuss how to BIP Report in oracle fusion HCM Step by step.
1. Go to the oracle login page and fill the id and password then sign in.

2. From the Home page, access Tools tab and go to the Reports and Analytics.

3. Click on Reports and analytics.
4. Click On Browse catalog and click on.

5. Click on Drop-down buttonCreate and selectData Model.

6. On the Diagram tab, click on (+) and select SQL Query.

7. In the New Data Set window:
a. Name: enter a name for the query
b. Data Source: Application DB_HCM
c. Type of SQL: Standard SQL
8. Write a query into the SQL Query box.

9. Click on OK Button, to exit the New Data Set window.
10. Select the Data tab.
11. Drop-down on Rows to increase the number of results returned.
12. Select the View button.
13. The results will default to Tree View for the XML; select Table View to see the results in table format.

14. First, we need to save the data has a Save as Sample Data

15. Once we can click on Save as Sample Data, we will get confirmation message. And click on ok button.

16. We can click on save symbol.

17. Select the folder where you want to save data model, Enter the data model name and click on ok button.

18. Click on Create Report.

19. Use the Report editor to Click on Finish button.

20. Save the report and click on ok button.

21. Click on Generate RTF layout based on selected Data Model.
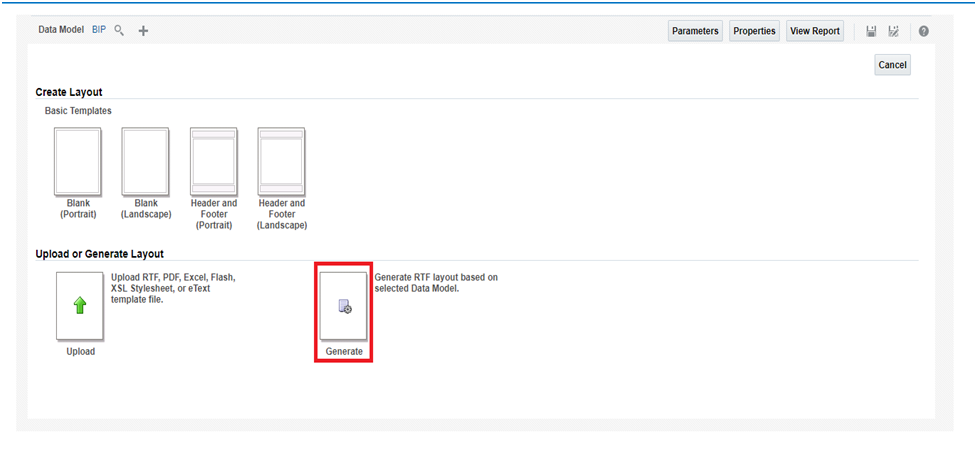
22. Write a Data model Name And Click on Generate.

23. Click on View Report.

24. Report is display like this. If we want we can view this report or Download print and different type of view report.

25. Both Data Model and Report are created successfully.
a. First is data model.
b. Second is BIP Report.

Good piece of information, Oracle Fusion HCM Online Training for HR managers who want to track employee information